Canadian home sales moderate further in January
Canadian home sales moderate further in January
Fri, 02/14/2014 - 09:00
Ottawa, ON, February 14, 2014 - According to statistics released today by The Canadian Real Estate Association (CREA), national home sales activity posted its fifth consecutive month-over-month decline in January 2014.
Highlights:
National home sales fell 3.3% from December to January.
Actual (not seasonally adjusted) activity stood 0.4% above January 2013 levels.
The number of newly listed homes edged up 0.2% from December to January.
The Canadian housing market remains in balanced territory.
The national average sale price rose 9.5% on a year-over-year basis in January.
The MLS® Home Price Index (HPI) rose 4.8% year-over-year in January.
The number of home sales processed through the MLS® Systems of Canadian real estate Boards and Associations and other co-operative listing systems fell 3.3 per cent on a month-over-month basis in January 2014. This marks the fifth straight monthly decline, and leaves activity 9.1 per cent below the peak reached in August 2013 (Chart A).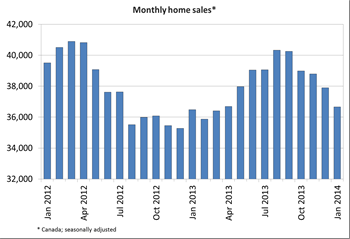
Sales were down on a month-over-month basis in more than 60 per cent of all local markets in January, with declines in Greater Toronto, Greater Vancouver, London and St. Thomas, Windsor-Essex, and a number of other Southern Ontario markets.
“A number of buyers likely waited out January’s deep freeze before going house hunting, particularly where I’m from in Southern Ontario,” said CREA President Laura Leyser. “It’s a perfect example of how a local influence that may not be shared by other markets can factor into national sales activity. Like the weather, all real estate is local. To see what’s driving the housing market where you live or might like to, your best bet is to talk to your local REALTOR®.”
Actual (not seasonally adjusted) activity stood 0.4 per cent above levels posted in January 2013. Year-over-year increases were recorded in less than half of all local markets, with gains across most of British Columbia and Calgary offset by declines in Southern Ontario, Quebec, and much of the East Coast.
“Canadian housing market performance in January was a weather report of sorts, with January’s Polar Vortex having dented both resale activity and new construction,” said CREA Chief Economist Gregory Klump. “We’ll be keeping a close eye on February’s numbers for signs of a rebound in Southern Ontario, where sales reflected deferred home purchases due to cold weather rather than home buyers getting cold feet.”
The number of newly listed homes edged up 0.2 per cent on a month-over-month basis in January. New supply was up in just over half of all local markets, led by Edmonton, Regina, Ottawa, and Montreal and offset by declines in Greater Vancouver, Calgary, and Greater Toronto.
With sales down and new listings little changed, the national sales-to-new listings ratio eased back to 52.4 per cent in January compared to 54.2 per cent in December. This remains well within balanced territory marked by the range from 40 to 60 per cent, as has been the case since early 2010. Just under two-thirds of all local markets posted a sales-to-new listings ratio in this range in January.
The number of months of inventory is another important measure of balance between housing supply and demand. It represents the number of months it would take to completely liquidate current inventories at the current rate of sales activity.
There were 6.4 months of inventory at the national level at the end of January 2014, up from 6.3 months at the end of December. As with the sales-to-new listings ratio, the current level of the months of inventory measure indicates that the Canadian housing market remains well balanced.
The actual (not seasonally adjusted) national average price for homes sold in January 2014 was $388,553, an increase of 9.5 per cent from the same month last year. The size of year-over-year average price gains continues to reflect the decline in sales activity at this time last year among some of Canada’s most active and pricey markets, which dropped the national average at that time.
The MLS® Home Price Index (MLS® HPI) provides a better gauge of price trends because it is not affected by changes in the mix of sales activity the way that average price is.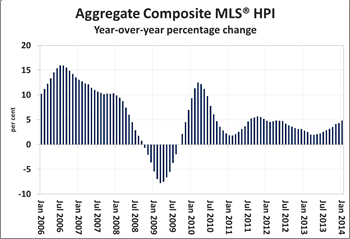
The Aggregate Composite MLS® HPI rose 4.83 per cent on a year-over-year basis in January 2014, up from a 4.31 per cent gain in December. Year-over-year price growth picked up among all property types tracked by the index.
Year-over-year price gains were led by two-storey single family homes (+5.57 per cent). This was closely followed by one-storey single family homes (+5.32 per cent), townhouse/row units (+3.94 per cent) and apartment units (+3.35 per cent).
Year-over-year price growth in the MLS® HPI was mixed across housing markets tracked by the index. Calgary (+8.98 per cent) and Greater Toronto (+7.06 per cent) again posted the biggest price gains.
Greater Vancouver recorded a third consecutive year-over-year increase (+3.18 per cent) after more than a year of declines between late 2012 and late 2013. While prices in Victoria remained lower than year-ago levels, January’s decline (-1.37 per cent) was the smallest in more than three years.
– 30 –
PLEASE NOTE: The information contained in this news release combines both major market and national sales information from MLS® Systems from the previous month.
CREA cautions that average price information can be useful in establishing trends over time, but does not indicate actual prices in centres comprised of widely divergent neighbourhoods or account for price differential between geographic areas. Statistical information contained in this report includes all housing types.
MLS® Systems are co-operative marketing systems used only by Canada’s real estate Boards to ensure maximum exposure of properties listed for sale.
The Canadian Real Estate Association (CREA) is one of Canada’s largest single-industry trade associations, representing more than 106,000 REALTORS® working through some 90 real estate Boards and Associations.